If you haven’t seen this tool lately, it’s worth another look! We’ve recently enhanced these visual graphs.
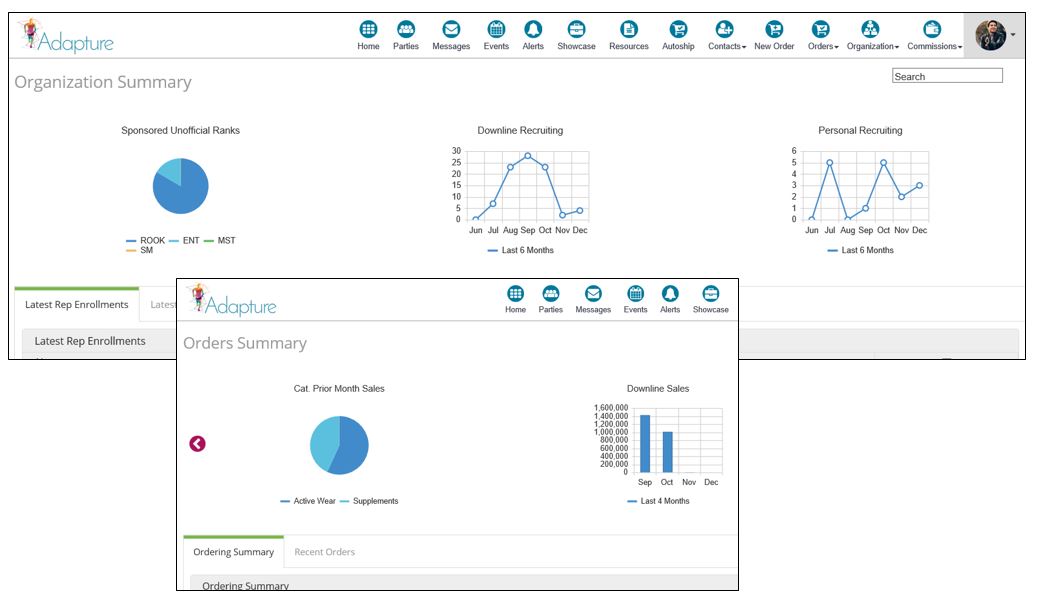
Upgraded (Pro) Reps have access to visual reporting for Orders, Organization and Commissions. In addition to providing at-a-glance insights about the health of an organization, earnings and business, these charts and graphs also:
- Display trend analysis over time to gauge growth/declines
- Provide details on the source of business, from product categories to bonus types
- Allow for easy comparison of a Rep’s personal business to that of his/her team, to identify coaching and leadership opportunities
PRO TIP: Year-end is the PERFECT time to evaluate your business using the Visual Trend Reporting, and set goals for the new year as a result:
– Which trends do I want to CONTINUE in the new year?
– Which trends do I want to REVERSE in the new year?
– How can I diversify my activity more evenly among various products, services, earning opportunities, etc?
– Is there a category I should focus on MORE, to build more income?
As a reminder, only those Reps with Pro/Upgrade access will see the Visual Trend Reporting in their back office.
These charts and graphs are configured within your Freedom Back Office, allowing you to choose which data points your Reps see, and which they don’t. Reach out today for support and configuration assistance on this tool. Plus, be sure to share these tips with your Reps, so they can get the most out of their online back office tools.